IT projects have a long tradition of being a shitshow. Have you ever been handed a project with a grand vision and large scope and absolutely no plan for how it will get done? A project where after you muster all of your ingenuity to meet the specification the funding dries up, the leaders have moved on and the deliverable is no longer relevant anyway. That is exactly what happened to Gaspard de Prony in 1791.
The Why
The French Revolution and Enlightenment were in full swing bringing about bureaucratic and ideological changes. Land was seized from Church and Aristocracy and sold back to the people at auction. Property tax reforms were proposed to make the tax burden fairer, and as a result the government needed an accurate survey of the land. Although bereft of the fancy surveying equipment we have today, they were still able to measure the land by using trigonometry and manual calculation. Think back to your high school maths, trigonometry is the one where you use angles, squares, sines and cosines to infer the lengths of the sides of a triangle, usually computed by pressing the relevant button on a scientific calculator. They did not have scientific calculators in the 18th century, and although they did have slide rules, at 2-3 decimal places those were not good enough to produce an accurate survey of the entire country. The gold-standard of the time was to look up the answer in a book. A book with hundreds of pages of tables of pre-calculated results, where you could look up the number 6.8 and find the sine to be 0.11840 or the natural log to be 1.91612. Like a dictionary of numbers and their transformations.
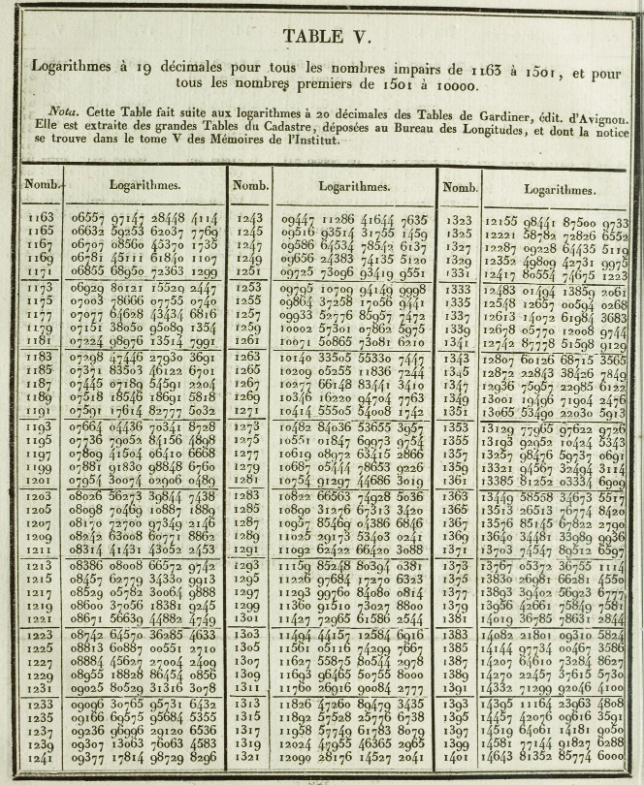 Example log table from Roegel, 2011. Check with your calculator. Mine says log(1163) = 3.0655797147 Roegel does mention there are a few mistakes in this table.
Property tax wasn’t the only change, it maybe wasn’t even the most exciting change during the French Revolution. Enlightenment philosophy encouraged a new vision of science, rationality and standardisation of measurement. The French decided they would mandate standard metric units across the country, and they would split everything into tenths. Ten months in a year, ten hours in a day, 100 minutes in an hour. As a result, a right angle would no longer equal 90 degrees but rather 100 grads. It was thought that this much simpler and cleaner system would catch on in no time, but there was one tiny problem. Changing how you measure angles immediately invalidates all previous pre-calculated tables for angular measurements.
The scope (do everything)
De Prony was an engineer and mathematician, who worked at the National School of Bridges and Roads (École nationale des ponts et chaussées) in Paris, and was the director general of the Ordinance Survey of France (Cadastre de la France). Therefore, the French government tasked de Prony with producing the new tables. And since project sponsors always ask for all the bells and whistles, he was explicitly told to make them “a monument to calculation the greatest and the most impressive that had ever been executed or even conceived”.
Execution
De Prony took on the task enthusiastically, some conjecture as a way to stay in Paris instead of being sent to the Pyrenees, where he had recently been appointed. To meet this audacious assignment he planned to double the “length of the greatest known tables” and recalculate even functions that were not changing, extending precision up to 7 decimal places beyond what existing tables offered. However, he soon realised that with current methods he “could not hope to live long enough to finish the project” and these tables were needed to calculate the new taxes.
While he was pondering how he could deliver, he came upon Adam Smith’s “Treatise on the Wealth of Nations”, published about 20 years earlier. Luckily for him “on opening the book at random, [he] came across the chapter where the author had written about the division of labour” (literally the first chapter). De Prony took note of Smith’s opening story about how one pinmaker could maybe make one pin per day, from start to finish, but ten pinmakers, each specialising in a different part of the process, could produce up to forty-eight thousand pins in a day, a huge increase in output. Inspired, De Prony set out “to manufacture [his] logarithms as one manufactures pins”.
The mathematical insight here is that the solutions to these complex functions could be calculated by only using addition or subtraction when set up in the right manner. De Prony had already been teaching these methods at École Polytechnique, and recognised that he could have a few highly skilled mathematicians set up the calculations, and then get unskilled labour to churn through just by following a set of pre-defined steps. His setup involved three groups. The first group, which included himself, where the highest skilled geometricians, who calculated some fundamental numbers, and worked out the algorithms that needed to be followed. The second group contained seven or eight calculators who understood the analysis and were able to take the work of the first group and set up the tables and instructions that would then be given to the third group. The third group had 70 or 80 non-mathematicians who could follow the instructions to fill in the tables. This group only needed to know how to add and subtract numbers. Each calculation would be done twice for quality control purposes.
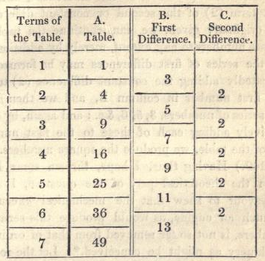
Here is a simple example for how you can calculate a table of square numbers using only addition. The first column (terms of the table) lists the base numbers. Column A contains the squares of those numbers. You can see the successive differences between the squares are in column B and the differences of differences in column C, which in this case is always 2. That means you can extend the table of squares, by successively adding 2 (the second difference) to column B (the first difference), then adding that number to column A (the previous square). Each of the formulas they wanted to calculate will converge like this after some number of differences (not always 2), and once you know the pattern you can set up a table to be calculated through addition. This is called the method of differences. From Babbage, 1846
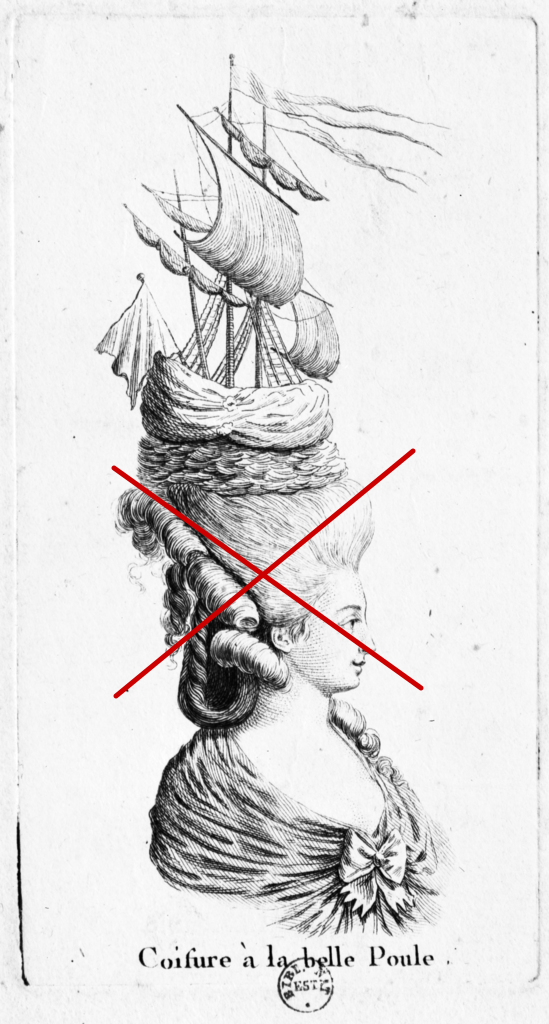
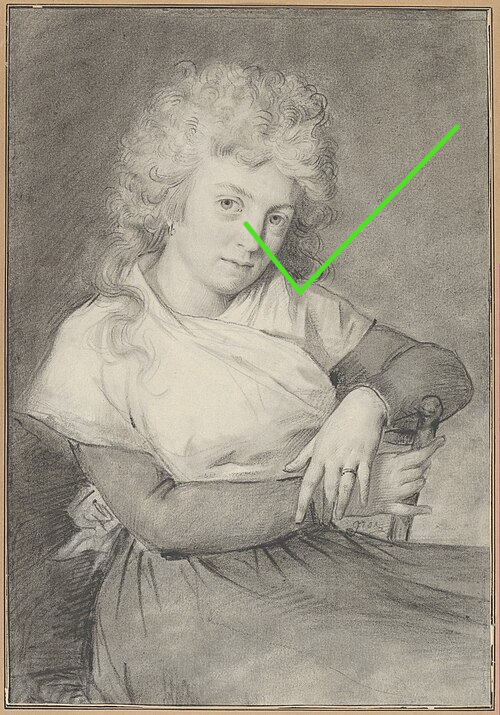
Apart from the tax changes and measure standardisation, another change during the French Revolution was the hairstyles. The intricate, wire-supported, pompous hairstyles of the past fell out of fashion as they came to represent the hated aristocracy; and shaggier, more natural styles came to dominate. This resulted in a glut of precise, high attention-to-detail, hard-working hairdressers with time on their hands who were recruited into De Prony’s third group.
With this setup De Prony was able to complete the calculation of the tables in just a few years, which produced 17 volumes containing high-precision results for over 2 million numbers. You would think that, having met the ambitious spec, this would be a triumphant conclusion to the project, but that’s not exactly what happened.
Roadblocks
While this work was ongoing, France did not actually pass the law to make everything decimal and so continued measuring time and angles as we know. In addition, the books were too expensive to print, and really, people didn’t need that level of precision for their calculations. As a result, De Prony ran the process again to produce an abridged, portable version in 9 days, while he continued to try and get the full version published for the rest of his life.
While presenting his methods to the French Academy of Sciences nearly 25 years after the tables were completed, De Prony told the audience that four hundred printing plates had already been prepared “when various causes due partly to the conditions of the contract between M. Didot and the [French] Government, and the collapse in value of paper money [Assignats] (this was the paper money printed by the French revolutionary government) forced the project to be suspended.” Plan B was for the British government to commission the printing, however, discussions halted when their representative, Sir Charles Blagden, died, although De Prony still held out hope this would move forward. In the end the tables were published in 1891, in an abbreviated form only, in one volume, nearly 100 years after their construction and after De Prony’s death in 1839.
Impact
In the end, the tables were delivered, but they cost too much to print, were too bulky to work with, and people didn’t need decimal sines and cosines after all. The abridged and older versions of the tables were more useful. But the new method laid the foundation for big changes. First, it started the transition that turned “calculators” from skilled professionals to unskilled labour. More importantly though, De Prony’s methods for deconstructing calculations, so that the bulk of the work could be done mechanically provided the foundation for the invention of calculating machines. Sometimes the value of a project is not what you expect it to be.
References
- Baron De Prony’s Description of the Construction of Mathematical Tables, M de Prony, 1824
- The great logarithmic and trigonometric tables of the French Cadastre: a preliminary investigation, Denis Roegel, 2011
- On the economy of machinery and manufactures, Charles Babbage, 1846
- The Origins of the French General Cadastre, Pierre Clergeot, 2003
- The Tables of de Prony Are Finally Published Ninety Years After they were Compiled, Jeremy Norman’s History of Information
- Work for the Hairdressers: The Production of de Prony’s Logarithmic and Trigonometric Tables, Ivor Grattan-Guinness, 1990